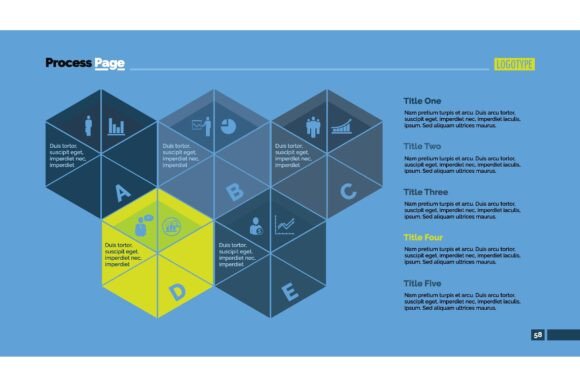
Four Hexagon Columns Process Chart Slide
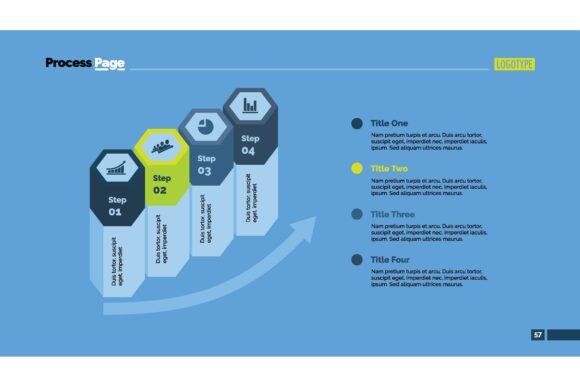
When you need to walk someone through a sequence of ideas—whether it's a project phase, a training module, or the logic behind a strategic decision—the way you show those steps matters. The four-hexagon column process chart slide template offers a refreshing alternative to ordinary bullet points or basic arrow diagrams. By combining four upright hexagonal columns, directional arrows, and clean diagrammatic space, it creates a flow that feels both organized and visually alive. It fits naturally into presentation decks, infographics, reports, and even onboarding materials. What makes it stand out isn't just the shape—it's the way those shapes guide attention and help audiences follow along without getting lost in a wall of text.
What Makes This Process Chart Template Unique
At its core, the design uses four distinct hexagonal columns arranged to show progression. Each hexagon can hold a headline, snippet of insight, or icon, and arrows between them reinforce movement from one stage to the next. Unlike flowchart-style boxes that can feel rigid or overly technical, hexagons introduce a subtle, modern geometry that catches the eye without distracting from the message. The chart works both as a vertical and horizontal story, so you can adapt the orientation to your slide layout. Because the columns are equally weighted, it’s a perfect fit for presenting processes that have four equally important phases—think discovery, planning, execution, and review—or for comparing four parallel tracks, such as different team responsibilities on a project timeline.
Who Benefits Most from a Four-Hexagon Column Layout
Different people look at the same graphic and see different kinds of value. While a project manager might appreciate how easily they can map out quarterly goals, an educator might value how quickly learners grasp relationships between concepts. The template’s usefulness stretches across roles because processes and stepwise thinking are universal, but the specific payoff depends on what you’re trying to accomplish.
For Corporate Trainers and Team Leads
If you’re designing onboarding sessions or internal workshops, you need visuals that reduce confusion, not add to it. The hexagon column process chart lets you break down a complicated procedure—say, handling a customer escalation—into four digestible chunks. Each column becomes a stage, with clear onward arrows that help employees anticipate what comes next. Because the shapes are distinctive, participants can often recall the steps later just by picturing the hexagon layout, which improves knowledge retention far more than a text-heavy slide ever could.
For Marketing Planners and Content Creators
Campaign planning often involves multiple moving parts: research, creative development, distribution, and measurement. A process chart built around four hexagonal columns turns that abstract cycle into a concrete visual that stakeholders can easily follow. When you pitch a content strategy, the template helps you avoid death by spreadsheet by presenting the logic in a way that sparks conversation rather than glazing over eyes. You might use one column to highlight audience insights, another for channel selection, a third for key messaging, and the fourth for success metrics—each flowing naturally into the next.
For Small Business Owners Presenting to Clients
Pitching your services to a potential client often means explaining how you solve a problem step by step. The four-hexagon column process chart slide keeps things professional without feeling corporate-stuffy. You can quickly personalize it to match your brand colors while maintaining a clean, trustworthy structure. A bakery owner explaining the custom cake design process, for example, could use one column for consultation, one for concept sketches, one for baking and assembly, and the final one for delivery and setup. The visual framing signals that you have a clear process, which builds client confidence before you even say a word.
For Educators and Instructional Designers
Learning happens best when information is chunked and connected. The hexagon column format helps do exactly that. Whether you’re building an online course module on the writing process or a classroom primer on the scientific method, the columns let you isolate key stages without isolating them from the bigger picture. Learners can see both the individual step and its relationship to the whole. Plus, the geometric style tends to appeal across age groups, making it a strong choice for higher ed slides and adult learning materials alike.
Using the Template to Simplify Complex Workflows
One practical strength of the four-hexagon column chart is that it excels at taming complexity without oversimplifying. Take strategic planning: you might need to show how vision, mission, objectives, and tactics connect. The four columns can hold these layers, with vertical space inside each hexagon for brief explanatory text. The arrows between them visually reinforce that vision shapes mission, which drives objectives, which feed tactics. That kind of clear causal flow is hard to achieve with standard slide elements but feels almost effortless with this structured yet flexible layout.
Consider a product launch. You could map phases like market analysis, design sprints, testing, and launch day across the four columns. Stakeholders from engineering, marketing, and leadership can each find their part of the story and understand how their work interlocks with others. Because the hexagons are equal in size, no single phase looks disproportionately more important—a small design choice that can subtly encourage cross-team respect.
Evaluating a Slide Graphic: Speed vs. Customization
When choosing any presentation tool, people often weigh two competing priorities: how fast they can get a polished result and how much control they have over the final look. The four-hexagon column process chart template balances both, but understanding your own leaning helps you use it well.
When You Need Quick Wins
Not everyone has hours to tweak graphics. If you’re racing against a deadline—maybe prepping for tomorrow’s status meeting—the template already provides a logical structure. You drop in your text, maybe adjust the color accents to match your slide deck, and you’re done. The heavy lifting of alignment, spacing, and arrow placement is already handled. For beginners or those who don’t consider themselves “design people,” this speed is a true lifesaver. There’s no need to learn advanced diagramming tools; the chart works right inside your presentation software.
When Brand Consistency Matters
On the other hand, a marketer or designer who wants every slide to reflect precise brand guidelines will appreciate that the template is editable down to the smallest detail. You can adjust hexagon fill gradients, arrow head styles, font pairings, and line weights. If your brand uses rounded corners, you can reflect that in the column shapes. If you need to emphasize one phase more than others, you can subtly change its opacity or size without breaking the visual flow. This flexibility means the same base template can appear crisp and minimal in one deck and vibrant and illustrative in another.
How Beginners and Experienced Designers Approach the Same Tool Differently
One of the underappreciated aspects of a well-built chart template is how it supports users across skill levels. A beginner might see the four-hexagon column layout and think, “Great, I don’t have to build this from scratch.” An experienced presentation designer might look at it and immediately start brainstorming custom combinations.
Starting with Zero Design Experience
If you’re not comfortable manipulating shapes, the template takes away the guesswork. You can edit the placeholder text directly, swap the icons if needed, and keep the default color scheme. The arrows will still point in the right directions. The hexagons will still align. No frustrating nudging of elements one pixel at a time. This reliability encourages beginners to present information confidently, knowing the visual structure communicates clearly even if they haven’t mastered advanced design principles.
Power Users and Custom Edits
More advanced users often treat the template as a starting point rather than a finished product. They might duplicate a column to create a five-stage variant (though the original four-column balance works best for many topics), or they might layer in animations where each hexagon appears on click during a live presentation. Some might embed mini-charts inside the columns, blending the process flow with data storytelling. The underlying geometry—four hexagons in a row—provides a solid foundation that supports creative experimentation without collapsing into visual chaos.
Does the Four-Hexagon Column Process Chart Fit Your Project?
Not every slide needs hexagons, and not every process fits neatly into four steps. Yet when you’re wrestling with content that feels like a natural sequence—a timeline of actions, a phased rollout, a comparison of four competing options that also follow a logical order—this template can bring clarity without extra effort. Ask yourself a few questions: Is my message sequential or parallel? Do I need to show movement between ideas? Would standard rectangles or circles fail to hold attention? If you answered yes, the hexagon column chart might be a strong match.
Also consider your audience’s expectations. A room full of data analysts might want a more detailed appendix, but the process slide can still serve as the high-level summary that frames the conversation. A group of creative directors might appreciate the modern geometric aesthetic, which signals you’ve thought about design as part of communication. The template’s versatility means you can pivot its application depending on the context without starting over from scratch.
Ultimately, the value of any visual tool lies in how much it reduces friction between your ideas and your audience’s understanding. The four-hexagon column process chart slide template does that by blending logical flow with approachable design. It doesn’t demand artistic skill, yet it rewards those who choose to refine it. Whether you’re mapping a team’s sprint cycle, teaching a new concept to students, or pitching a client on your proven methodology, those four hexagonal columns create a memorable path that viewers can follow—and that’s precisely what effective process communication is all about.